

You’ll end up with a GA4 property whose measurement ID sits on your published domain, and events arriving in Realtime once the flipbook is live.
You’ll need
- A Google Analytics account you can create a property in.
- The domain you publish flipbooks to — normally your cName — and a flipbook you can publish or republish.
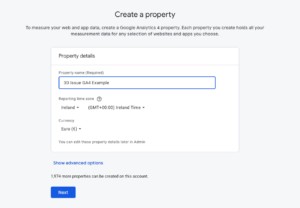
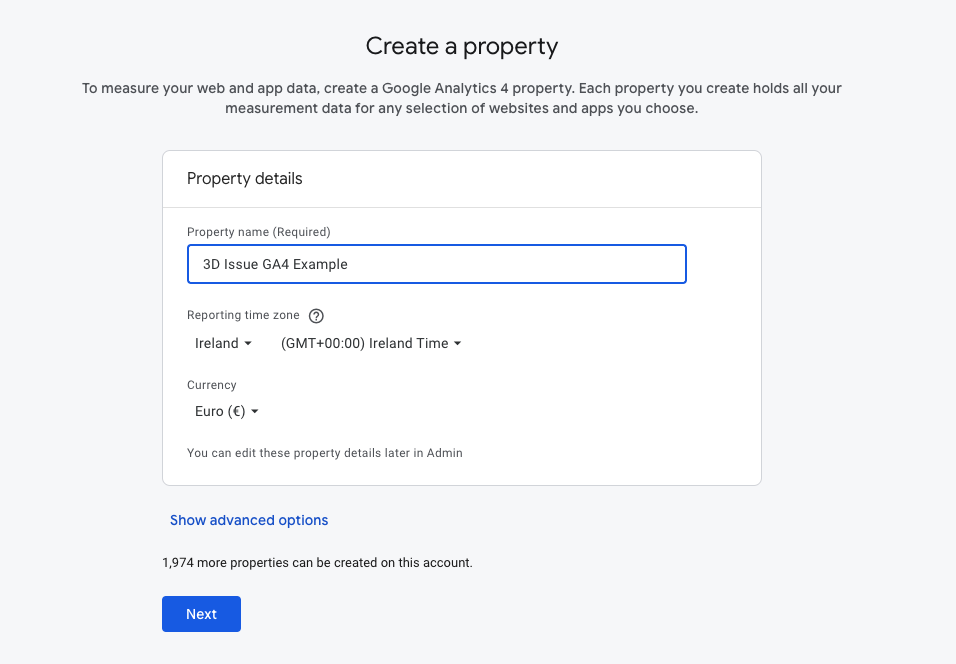
- In your Google Analytics account admin area, create a new property. Give the property a relevant name and set the Time Zone and also a currency (even if this is not needed for your publication tracking). Click ‘Next’.
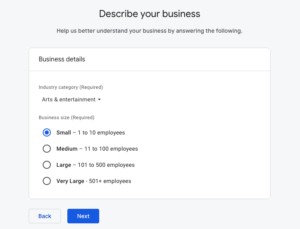
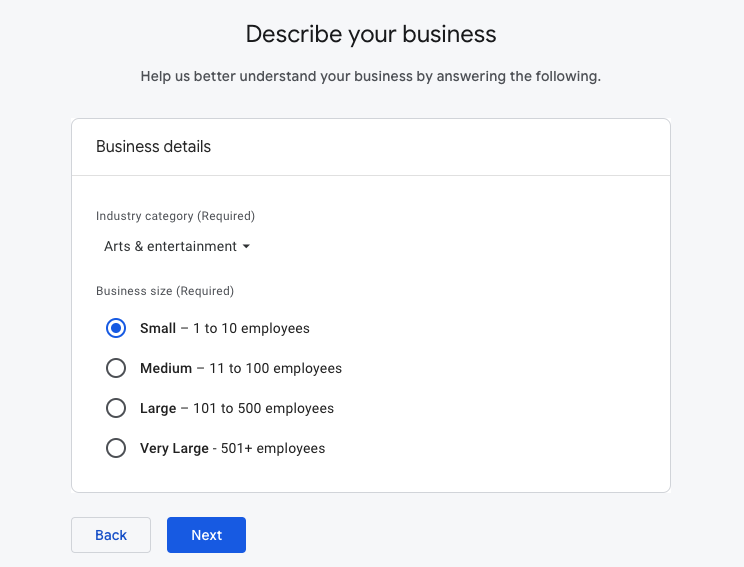
- Set your industry category and give an estimate of your company size. Click ‘Next’.
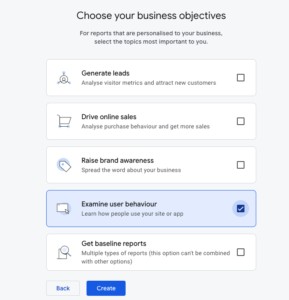
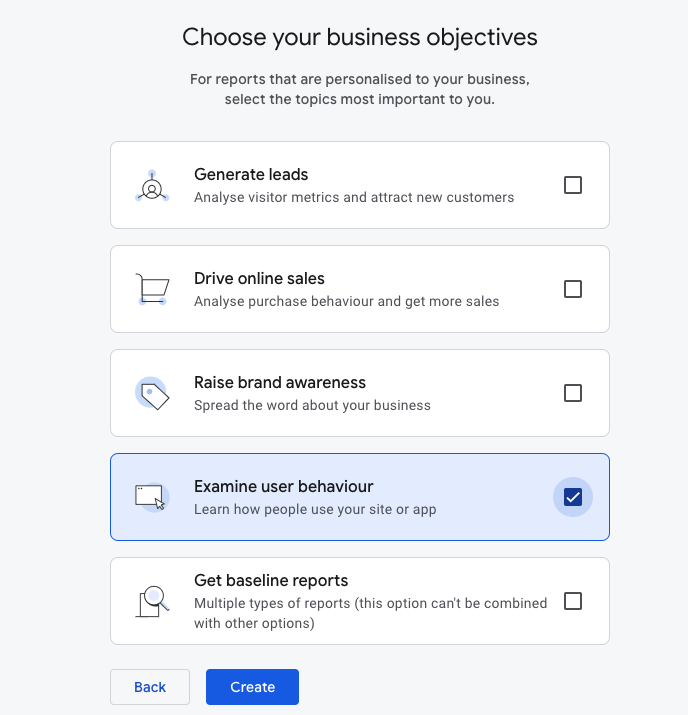
- Choose ‘Examine User Behaviour’. Click ‘Create’.
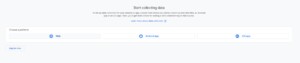
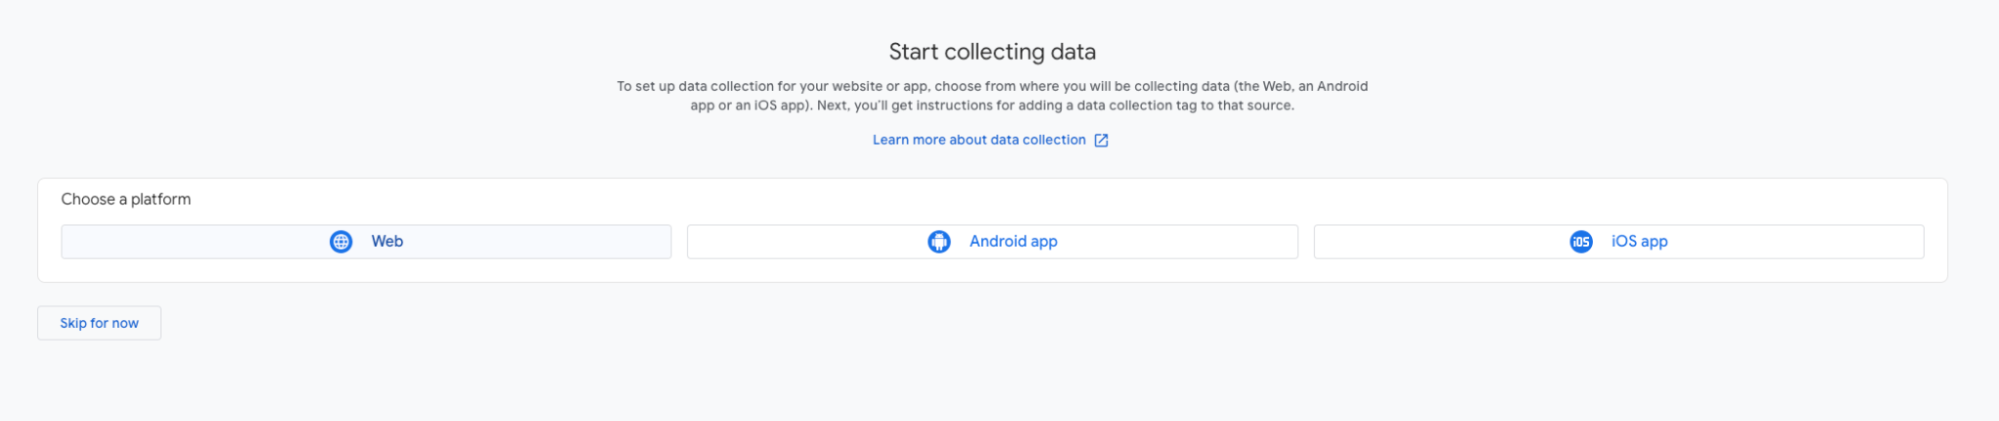
- Click on ‘Web’.
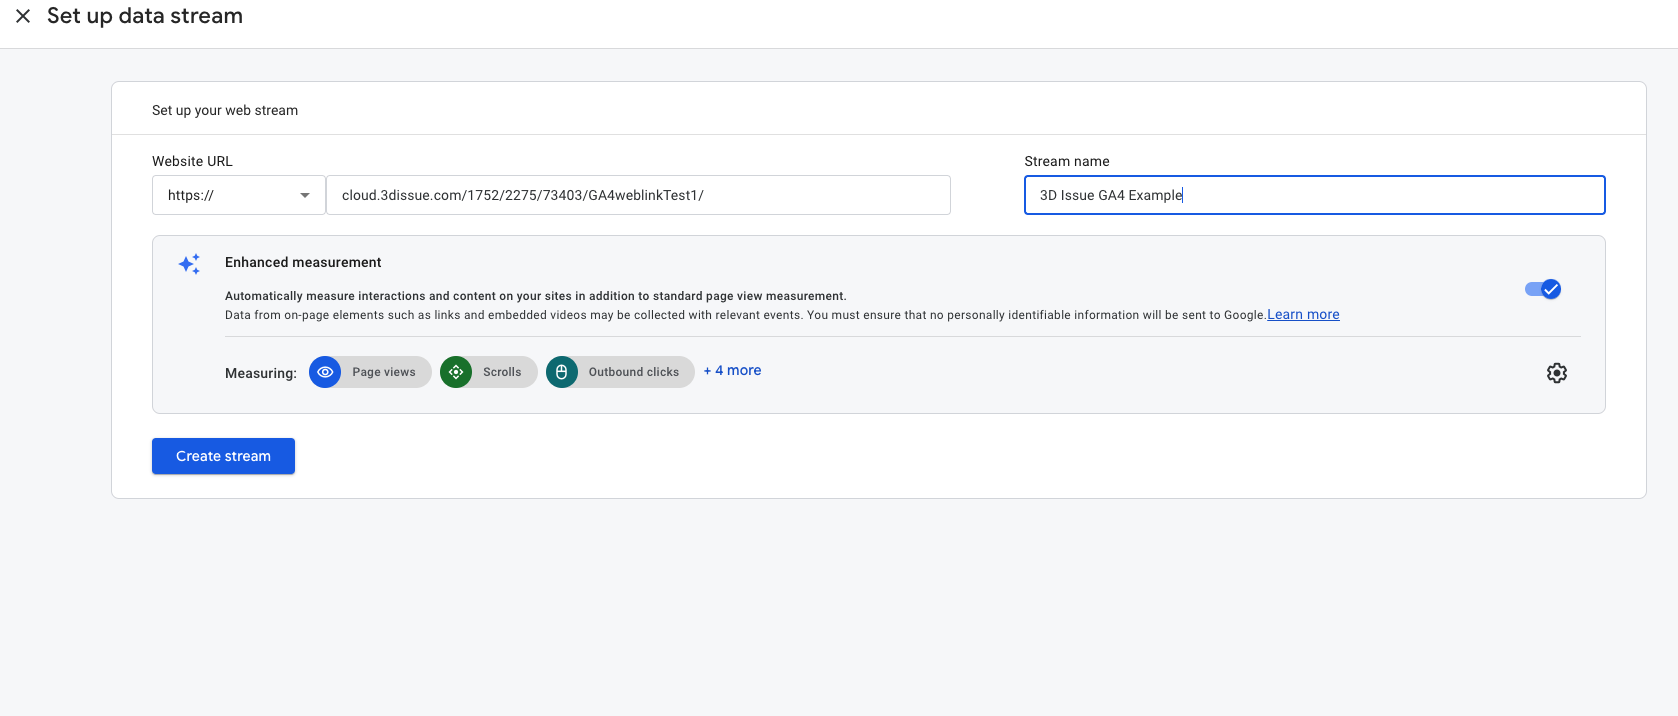
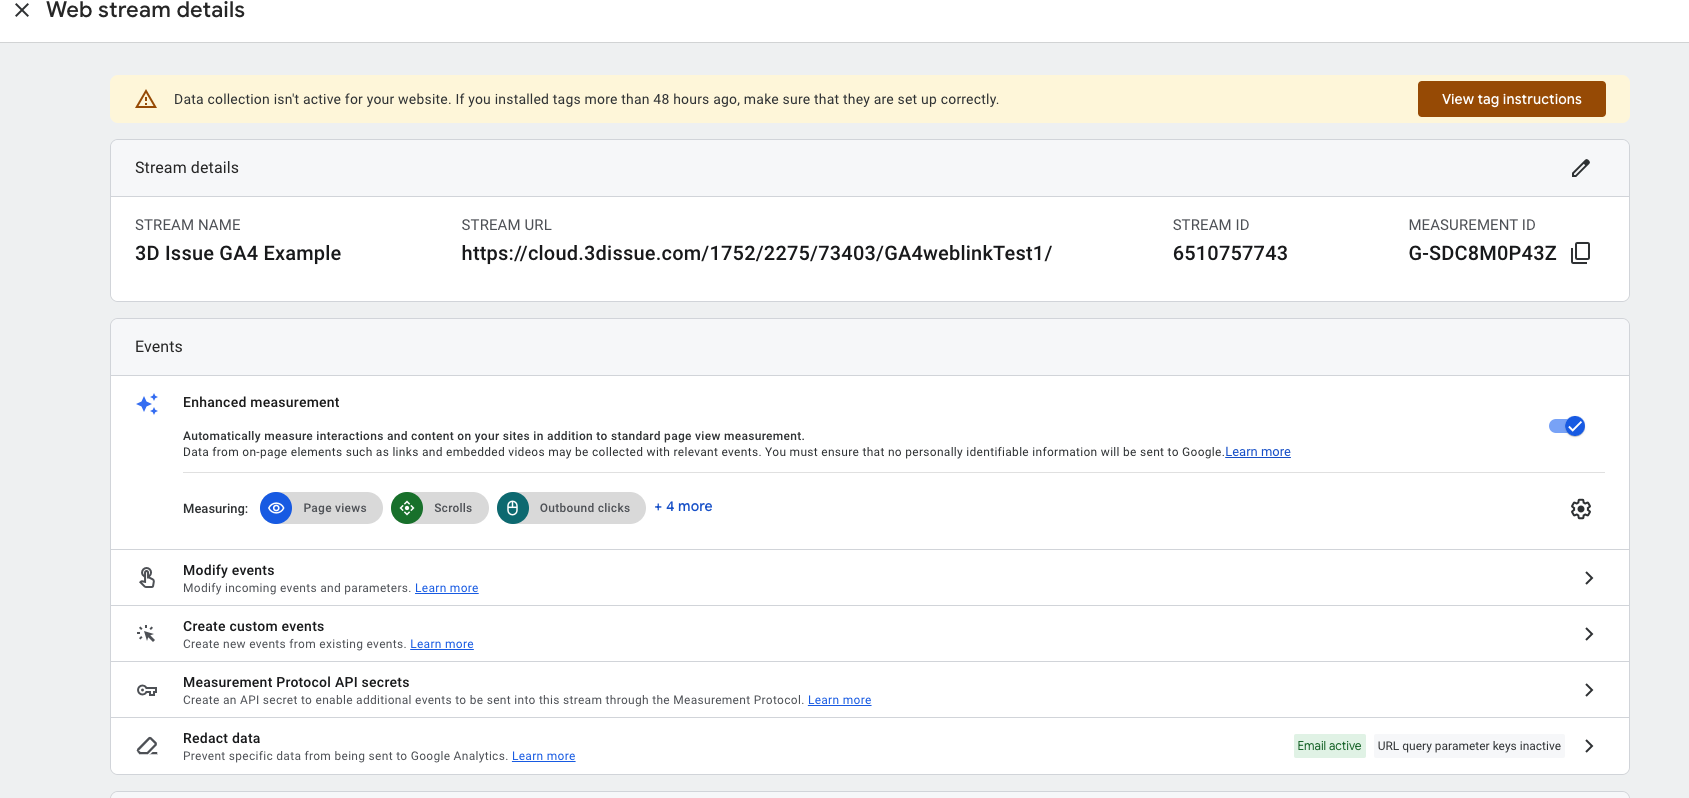
- To set up your data stream, enter the domain or publication URL you will be tracking (this is usually your cName – the example below uses an individual flipbook publication URL specifically for the purposes of creating this guide) and give the stream a relevant name. Make sure ‘Enhanced measurement’ is enabled. Click ‘Create Stream’.
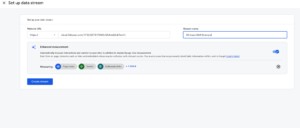
- You will now be presented with your ‘Measurement ID’. This is your individual GA4 tracking ID. Copy this number and click on the ‘X’ to move to the next step.
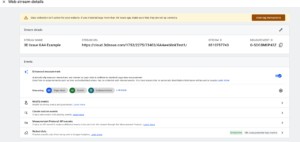
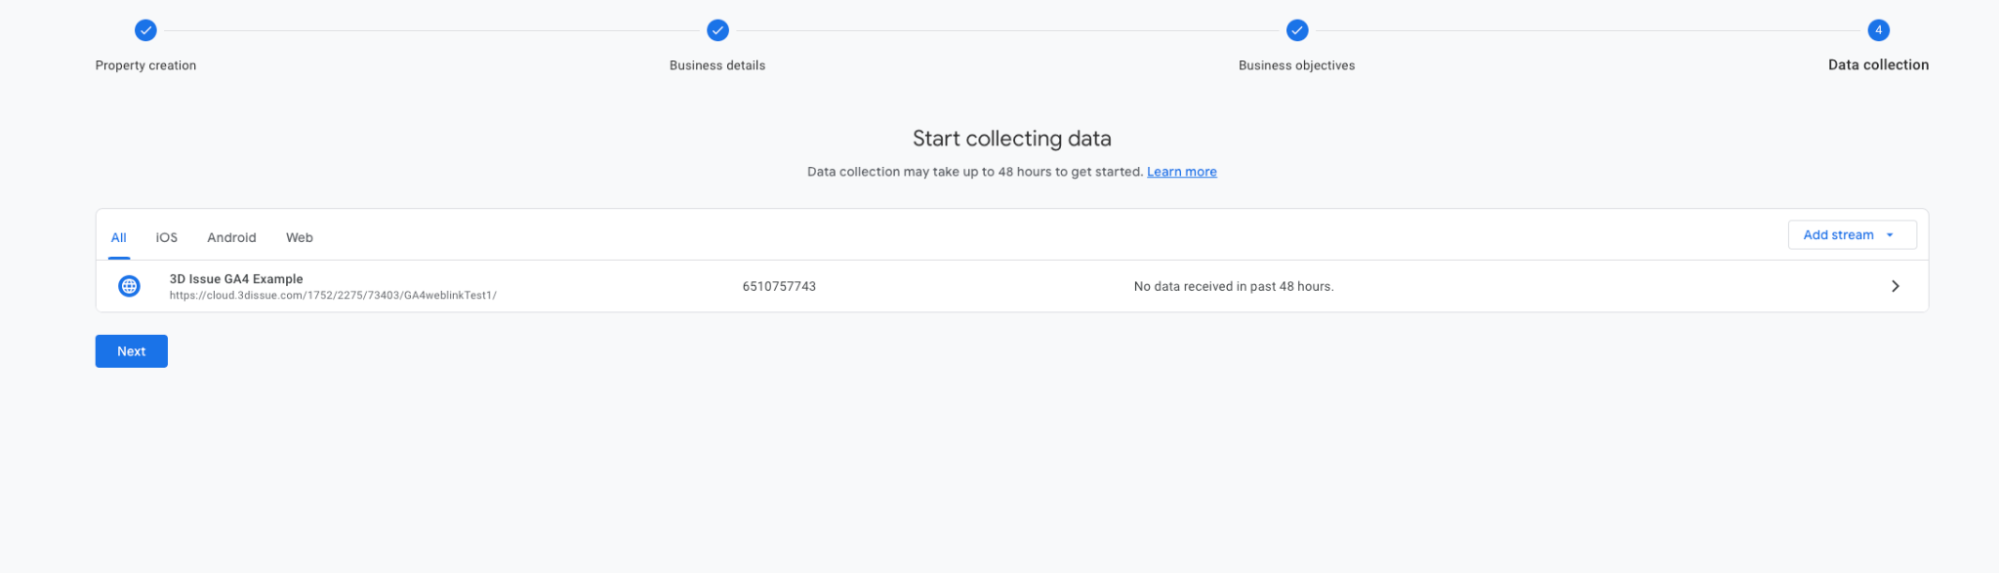
- Review your data stream details. Note that data has not started to be collected at this point. Click ‘Next’.
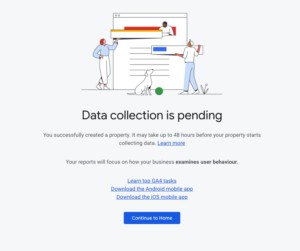
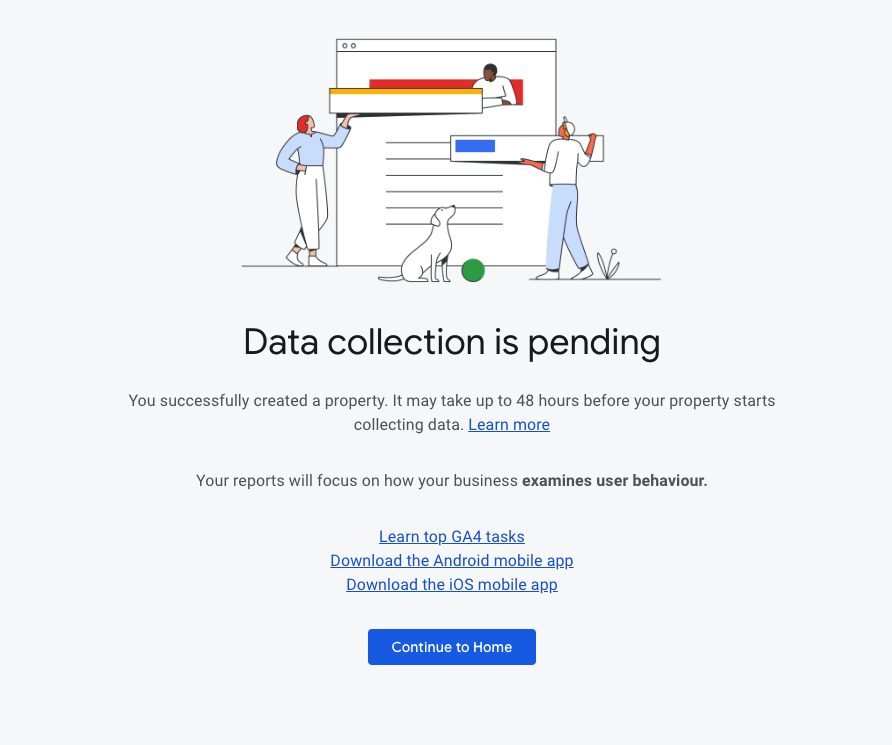
- Click ‘Continue to Home’.
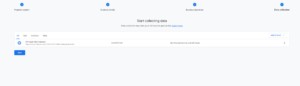
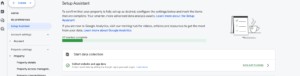
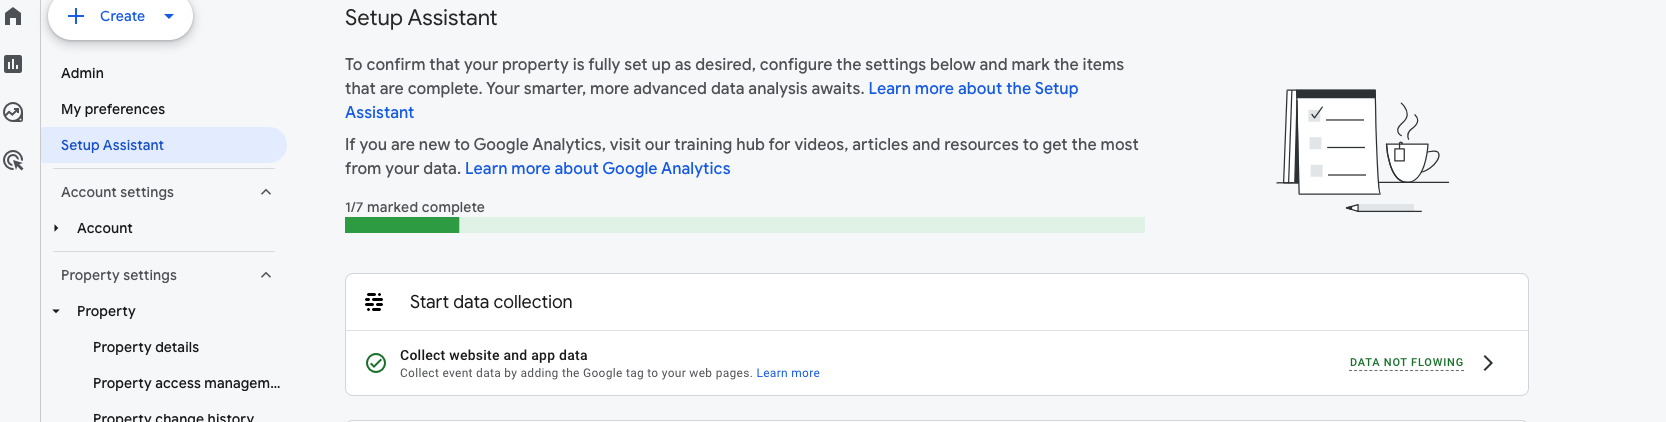
- Under ‘Setup Assistant’ enable ‘Start Data Collection’. This can also be done later after you have published your flipbook.
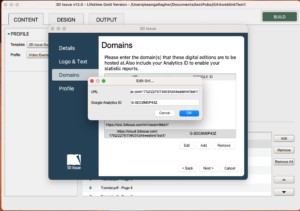
- In the 3D Issue Flipbook software, under ‘Content Tab -> Profile’ click ‘Edit’ then go to the ‘Domains’ section of the popup wizard. Add or edit the existing domain that you used to set up your data stream and add the GA4 tracking ID that you copied in Step 6.
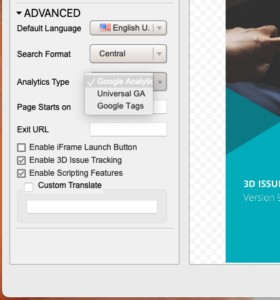
- In the ‘Design’ tab under ‘Advanced’, ensure ‘Google Analytics’ is set as the ‘Analytics’ type. You can now publish your flipbook (or republish an existing flipbook) that you wish to track using GA4.
- If everything is set up correctly, back in your Google Analytics account you can go to ‘Reports -> Realtime Events’ to see your analytics data being recorded in real time.
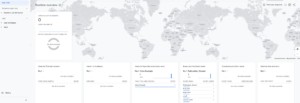
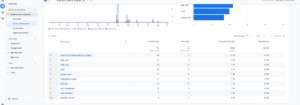
- After 48 hours you should start to see your full results listed by time period. To inspect the granular event data, click on ‘Events: Event name’ on the left hand side of the dashboard. This example looks at ‘Websites Visited’ by clicking on number 10 in the list of events above.
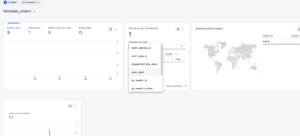
- This will open this event category. By clicking on the ‘Parameter Name’ drop down gives access to the event label.
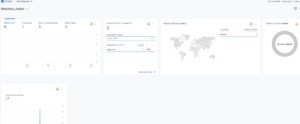
- This shows the URL(s) that the user has visited from the flipbook publication.


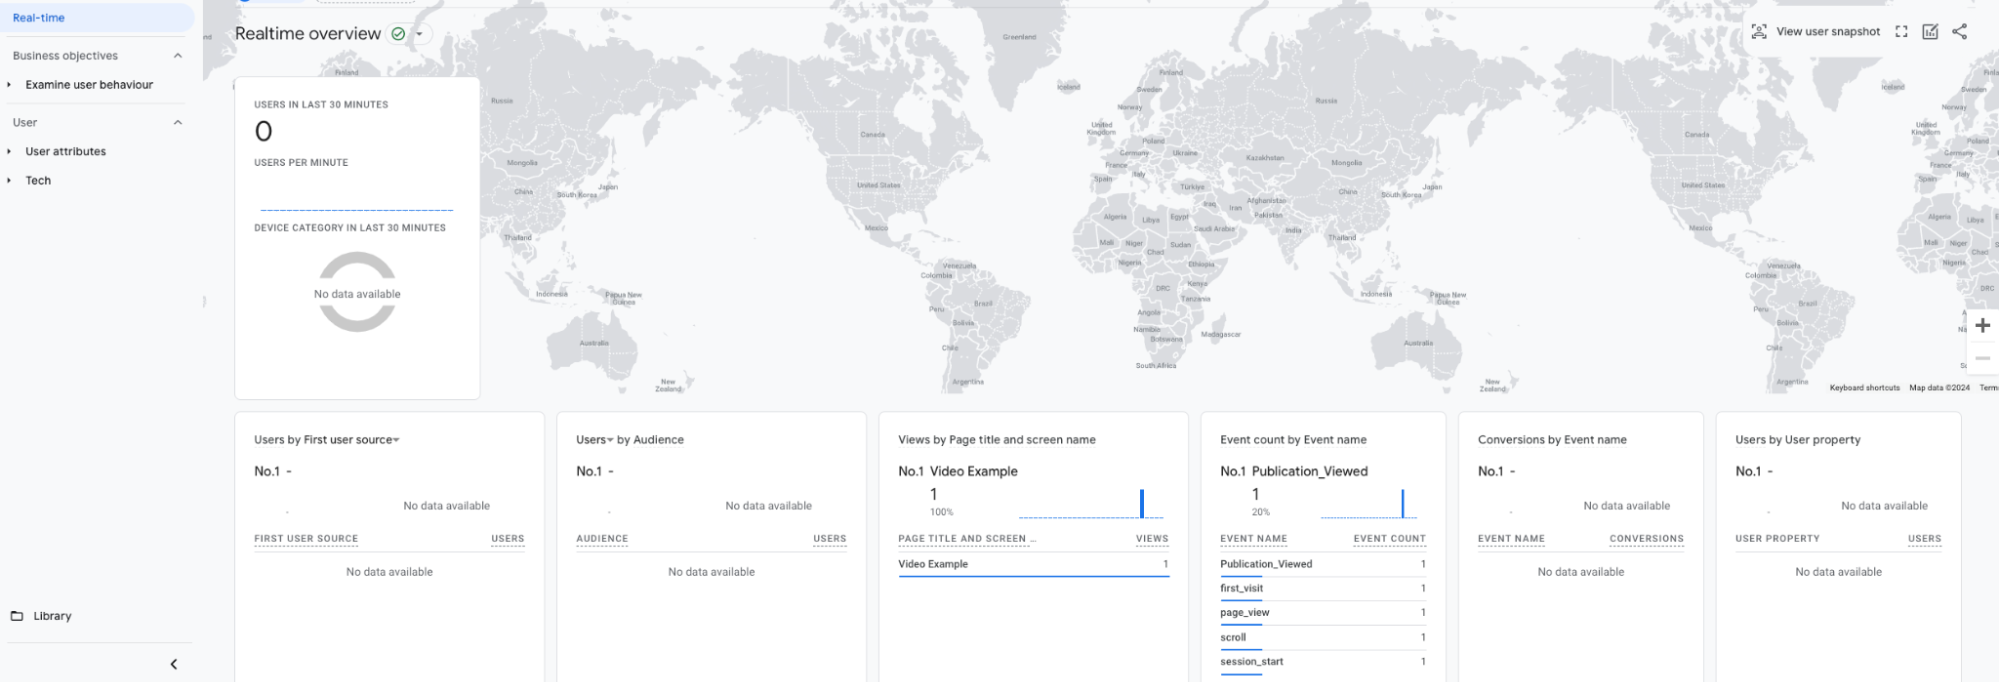
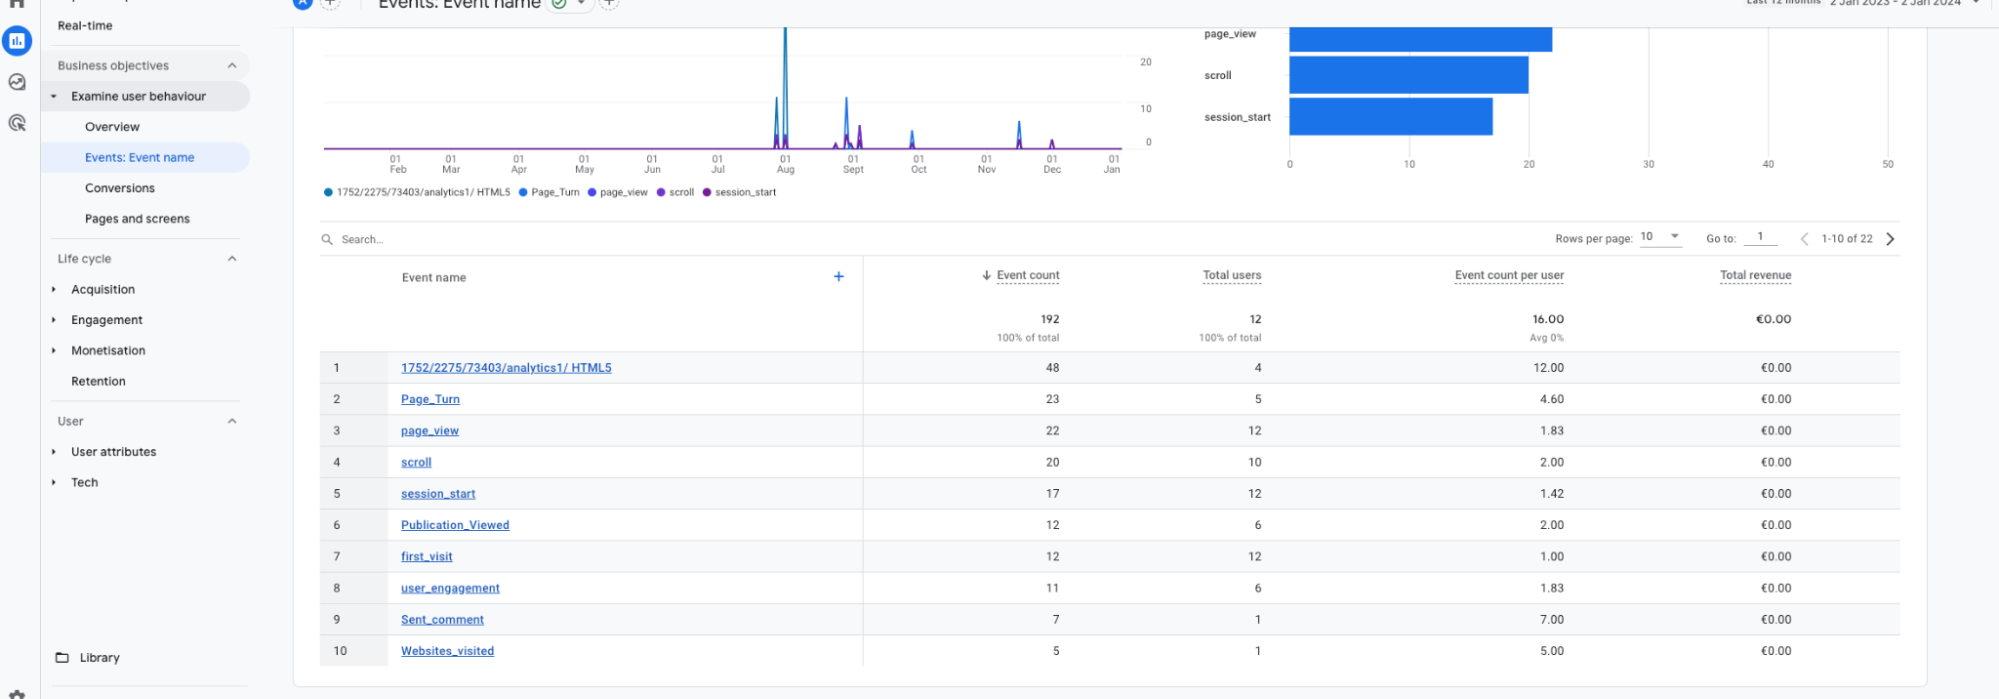
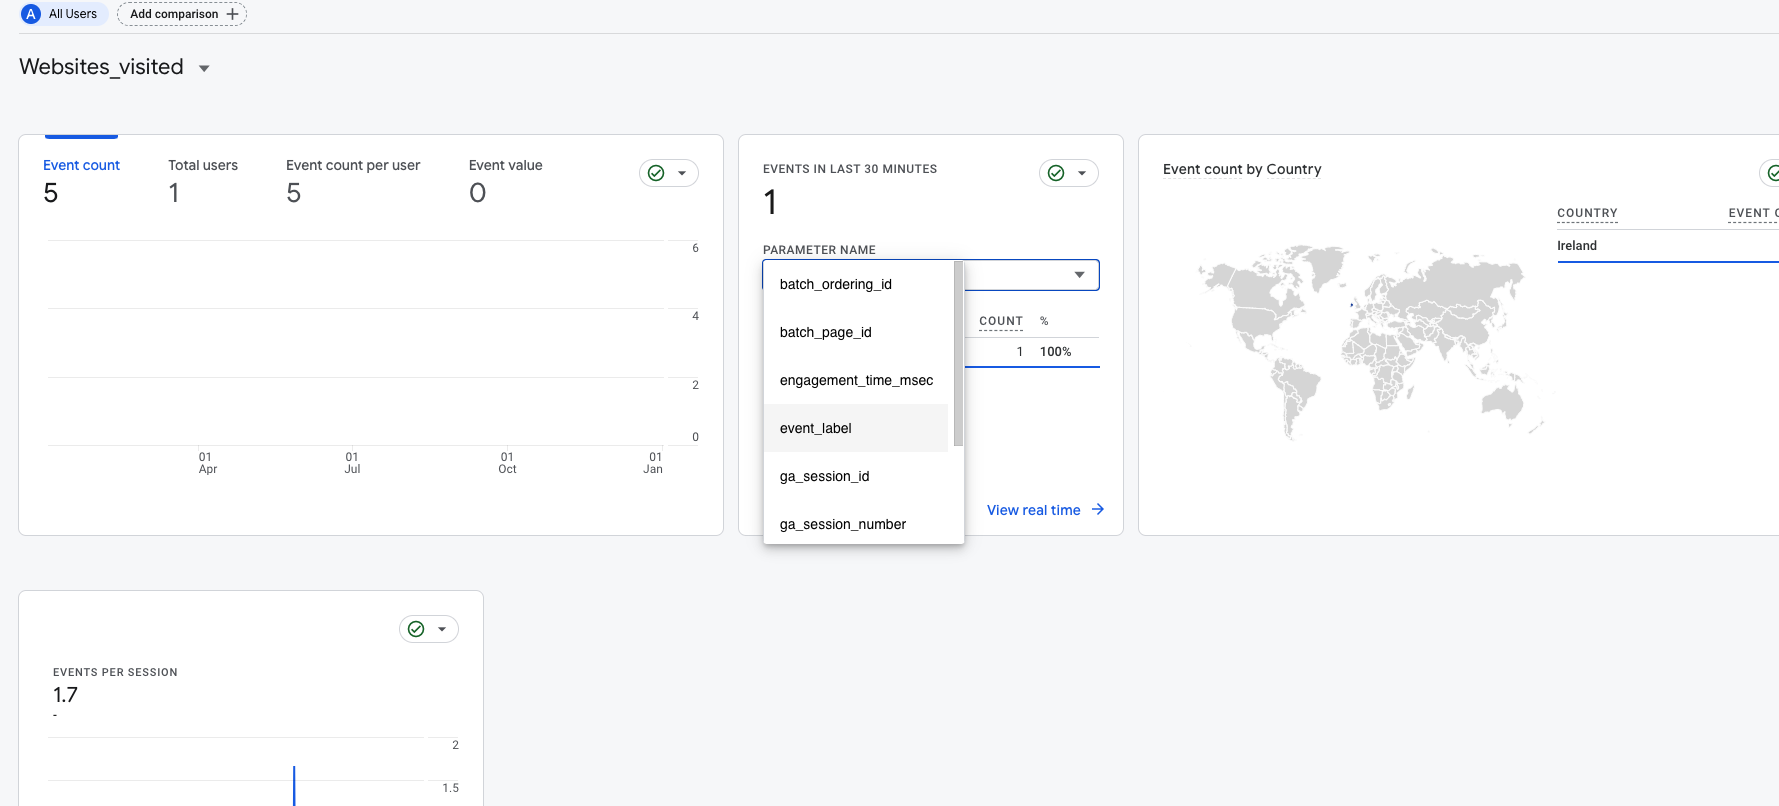
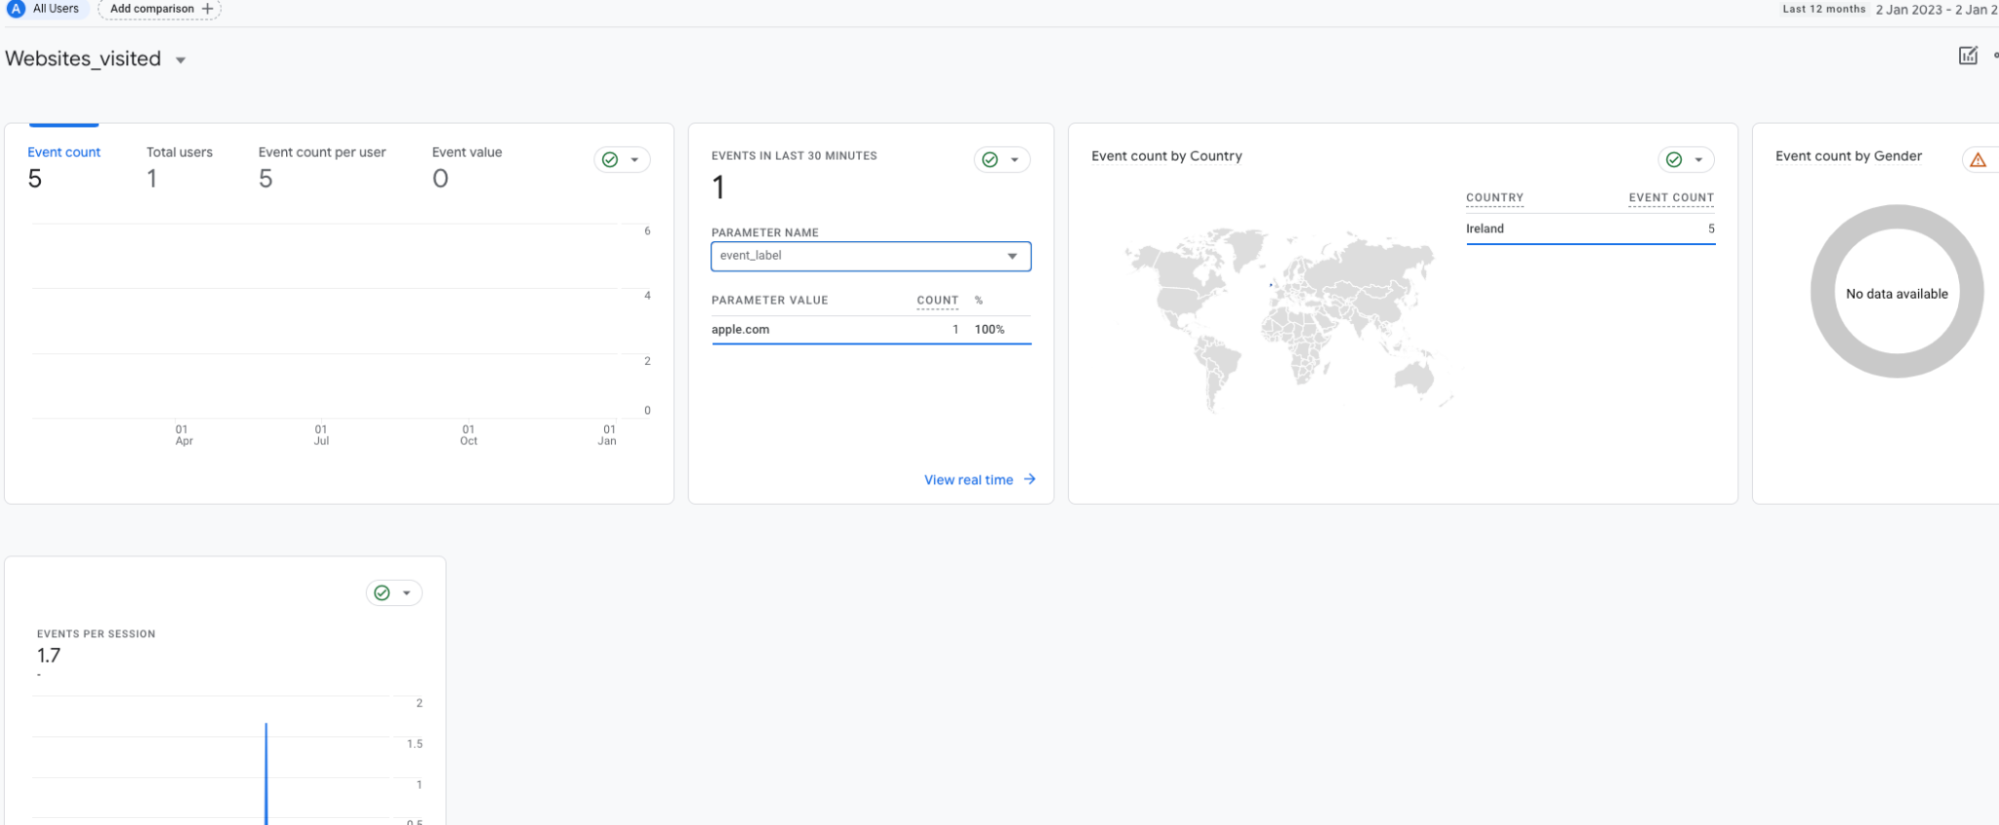
What the publication sends as events, and what each report then shows, is What can I track through Google Analytics?. For more details on how to set up your results dashboard to display specific data sent from your flipbook and to create comparisons and other data representations visit Google Analytics Help:
https://support.google.com/analytics/?hl=en&sjid=14869599761661097697-EU#topic=14090456
If it doesn’t work
- Nothing appears in Realtime. Check all three links in the chain: the domain carries the ID, Analytics under Design → Advanced is set to Google Analytics, and the flipbook has been published or republished since.
- Only Realtime has data. That is expected early on: full reports can take up to 48 hours to populate after collection starts.